Executive Analysis
The Executive Analysis page provides AI-powered insights into your organization’s performance. It is designed for leadership — department heads, project managers, and org admins who need a high-level view without digging through individual boards and sprints.
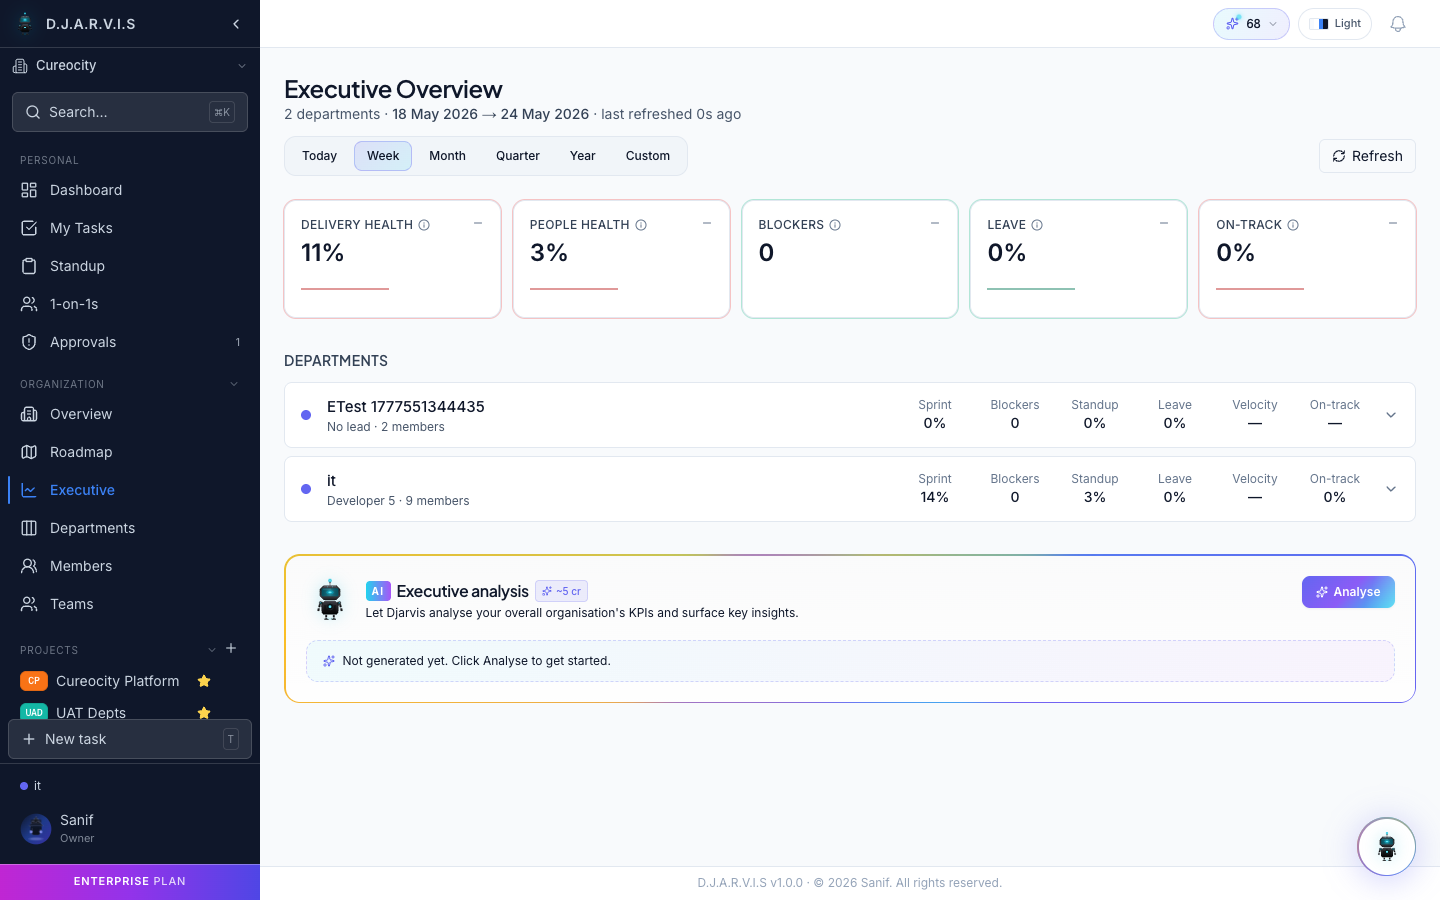
Performance metrics
Takonaut analyzes data across all your projects and surfaces key performance indicators:
- Team velocity — how much work your teams are completing per sprint, measured in story points or task count.
- Sprint completion rates — the percentage of planned work that actually gets done by sprint end.
- Productivity trends — week-over-week and sprint-over-sprint changes in output, highlighting improvements or dips.
These metrics are computed from real task and sprint data, not estimates. They reflect what actually happened.
Team health
Beyond raw numbers, the analysis identifies signals that something may need attention:
- Bottlenecks — tasks or stages where work is piling up (e.g. too many items stuck in code review).
- Blockers — unresolved blockers across sprints that are slowing teams down.
- Risks — sprints with a high percentage of unfinished work as the end date approaches, or teams carrying too much WIP (work in progress).
These insights help you intervene early rather than discovering problems at the sprint retrospective.
Strategic insights
Takonaut generates recommendations based on the patterns it finds in your data. Examples include:
- Suggesting that a team’s sprint capacity be adjusted based on historical velocity.
- Flagging that a particular project has had consistently missed deadlines and may need resourcing.
- Recommending process changes when certain task types take disproportionately long.
Recommendations are actionable — they point to specific teams, projects, or patterns rather than offering generic advice.
Trend analysis
Historical performance is displayed as trends over time, making it easy to spot:
- Seasonal patterns in productivity.
- The impact of team changes or process adjustments.
- Long-term trajectory — whether the organization is improving, plateauing, or declining in key areas.
Department comparison
For organizations with multiple departments, the executive view offers side-by-side comparisons:
- Sprint velocity per department.
- Completion rates and blocker frequency.
- Resource utilization across teams.
This helps leadership allocate resources and identify departments that might benefit from additional support or process improvements.